This website uses cookies to collect statistics about our visitors and to help us analyze how the site is used. Please see our privacy policy. By clicking "I agree" you agree to our use of cookies and similar technologies.
Discover High Yield Dividend Stocks in the US
Empower your investment ideas. Invest systematically. Save time and money.
What is Dividend Investing Strategy ?
Whether you’re looking for reliable sources of passive income or new capital to re-invest, dividend investing can be a vital strategy that helps you keep your risk under control.
Identifying high yield dividend stocks has never been simpler. Discover new investment opportunities, track and analyse your portfolio and test your ideas. Trust Aurora DIY Investing to help you meet your investment goals.
No obligation free trial.
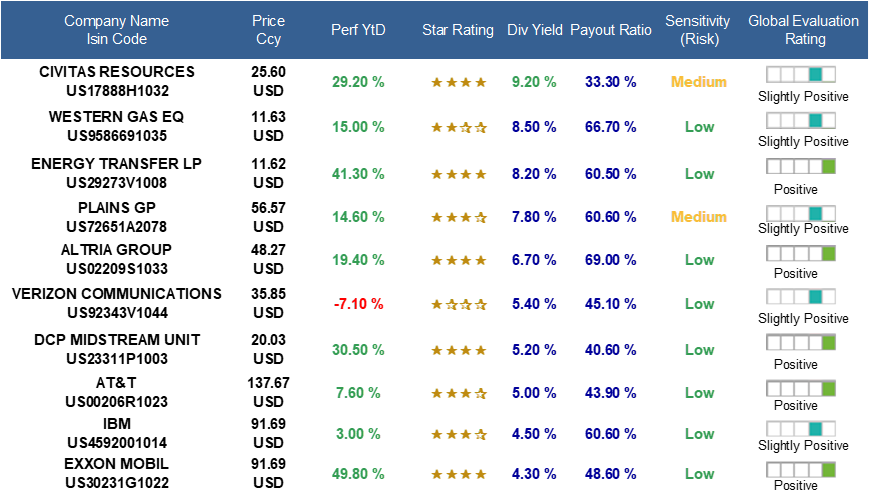
US High Dividend Yield Stocks
What You Need To Know ?
If you decided that the dividend stock strategy meets your goals, you need to identify stocks that are paying high dividend yields but at the time you should also look at the overall quality of the stock.
Aurora DIY Investing doesn’t simply give you a breakdown of the best-performing dividend stocks in the US and around the world, it also provides vital insight into the other factors such as earnings, valuation, momentum, performance and risk, before making your picks.
The parameters you should analyze before busing a dividend stock are:
Dividend Yield:
Look at the forward expected dividend yield. Aurora is providing you the 12M expected dividend yield.
Payout ratio:
This is the dividend as a percentage of a company’s earnings. In general terms, the lower the payout ratio, the more sustainable a dividend should be. For example, if a company pays out $5 a share and has $10 of earnings, 5 divided by 10 is 0.5 – or 50 percent. The payout ratio is 50 percent.
In Aurora, the value of the dividend yield is black, green, blue, or red, depending on the payment rate relative to the annual profit in -%.
Black colored when payout = 0
Green colored when payout between 0 and 40% (0 < payout <= 40)
Blue colored when payout between 40% and 70% (40 < payout <= 70 )
Red colored when payout > 70%
Dividend stability and growth over time.
Investors should also look at the historical dividend yield. Long-term dividend stability and growth are signing health and growth.
With Aurora, you can follow the historical expected dividend yield chart.
Market Capitalization:
Generally, as larger the company is, the dividend yield is more stable and consistent.
With Aurora, you can filter dividend yields by the company’s market capitalization.
Valuation:
It is very important to analyze stock prices. Picking a dividend stock.
Stock prices can go up and down, therefore you can receive a good dividend yield but on the other side lose because of a share price decline.
Our Valuation rating indicates if a stock is selling at a relative premium or bargain price, based on its growth potential.
To estimate a stock’s value relative to its current price our Valuation rating combines:
- stock price
- projected earnings
- projected earnings growth
- Dividends.
By combining these elements we can establish a rating for the analyzed company.
There are five ratings, ranging
- Strongly overvalued
- Moderately overvalued
- Fairly priced
- Moderately undervalued
- Strongly undervalued
Sensitivity (Risk)
Stock price movements are generally volatile and contain sensitivity that can result in a total loss. Based on their historical behavior, we classify stocks by sensitivity level which are assessed solely relative to other stocks.
It should be noted that even Low Sensitivity stocks remain highly sensitive investments that can lose up to all of their value, and that past performance is no indication of current or future performance.
We determine Sensitivity by measuring the “Bear Market” Factor and the “Bad News” Factor against the benchmark and identify three levels:
Low Sensitivity: In this case, the sensitivity indicators fall below the world reference average.
Moderate Sensitivity: In this case, the sensitivity indicators are higher than the world reference average but lower than the standard deviation.
High Sensitivity: At which the sensitivity indicators are at levels higher than the standard deviation.
Global Evaluation Rating
Designed to give a broad overview of an overall investment Quality at a particular point in time, Aurora’s Global Evaluation Metric combines multiple factors which we outline in more detail below. These include fundamental and technical elements such as Valuation, Earnings Revisions Trend, Technical Trends, and Group Benchmarking, along with sensitivity (Risk) ratings based on the “Bear Markets” and “Bad News” Factor Metrics. These factors are then visualized as a simple volume bar that indicates the best possible rating and indicates the worst.
What we offer
- Intuitive, user-friendly interface that saves you time.
- Analysis and ratings for 40 Stock markets, 100 Sectors, 6,000 Stocks, 15,000 Funds and 1,200 ETF's.
- On-Line portfolio diagnostic and alerts to monitor and control your portfolio.
- All-In-One subscription for all markets and products.
- Twice-Weekly updates of our ratings and analysis so you can stay informed.
- Totally independent, transparent, unbiased research with no hidden motives, commissions or costs.
- Analysis and ratings, Powered by theScreener AG Switzerland, trusted by leading financial institutions and asset managers for over 20 years.
Pricing
Popular
About Aurora DIY Investing
AURORA is a powerful, accessible DIY investing tool for the research and analysis of stocks, funds and portfolios and was created by SDIS Global AG in Switzerland.
AURORA analysis and evaluations are powered by theScreener which has more than 20 years of experience in securities research and analysis and is used by some of the world’s leading investment managers and banks, supporting more than 10 million end-users each month.
The system provides financial information and data to help you identify investment ideas. However, we do not advise you or guide you about this or what products to purchase or sell – these decisions are yours only, and you should do your own analysis before making any investment based on your own personal circumstances.
SDIS and the system are not subject to regulation, and SDIS does not hold a license for investment advisory, investment marketing or investment portfolio management under any law.The content provided on the system is independent and not based or tailored to your personal circumstances, to your needs or for your purposes, and should not be relied on as an estimate of profitability or the suitability of an investment in a particular stock for any purpose. Past performance is not a guarantee of present or future performance. Investments may lose its full value.